


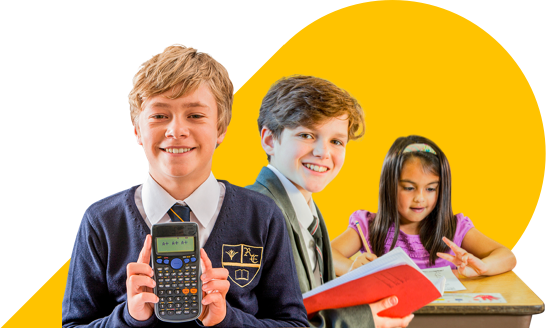
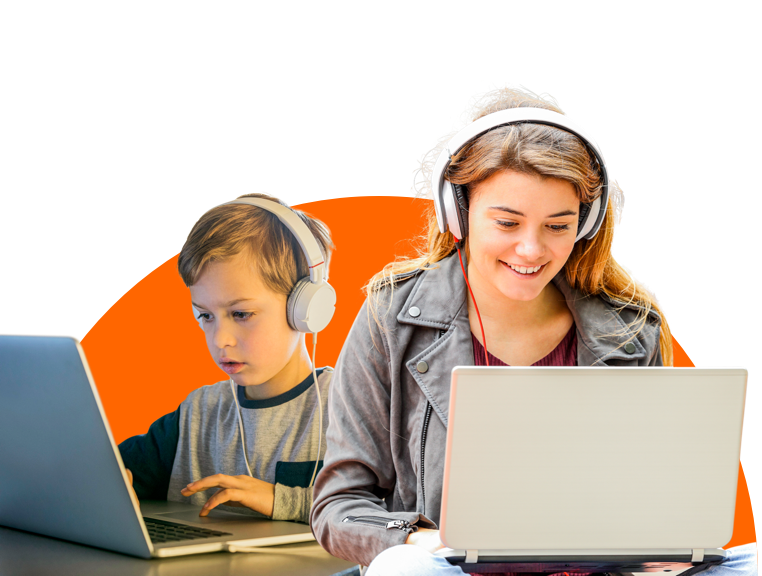
Our Maths Tutoring programs provide students with patient, expert teachers across all levels
Expert tutors
That are friendly and relatable.
Quality content
Created by teaching specialists.
Delivered online
From the comfort of home at a time that suits you.
Our goal? Identical to yours.
Let's find the right Maths program for you


Maths is such an essential subject to master
Calculators have taken up most of the hard work our minds did a generation ago, but knowing how mathematical concepts work and how to apply them in the real world is still important.
At Cluey, your student can get access to skilled tutors across all primary and high school level maths (and beyond if they want extension work). It’s the easy way for them to master a fundamental skill that will help them throughout life.
How does Cluey Maths tutoring work?
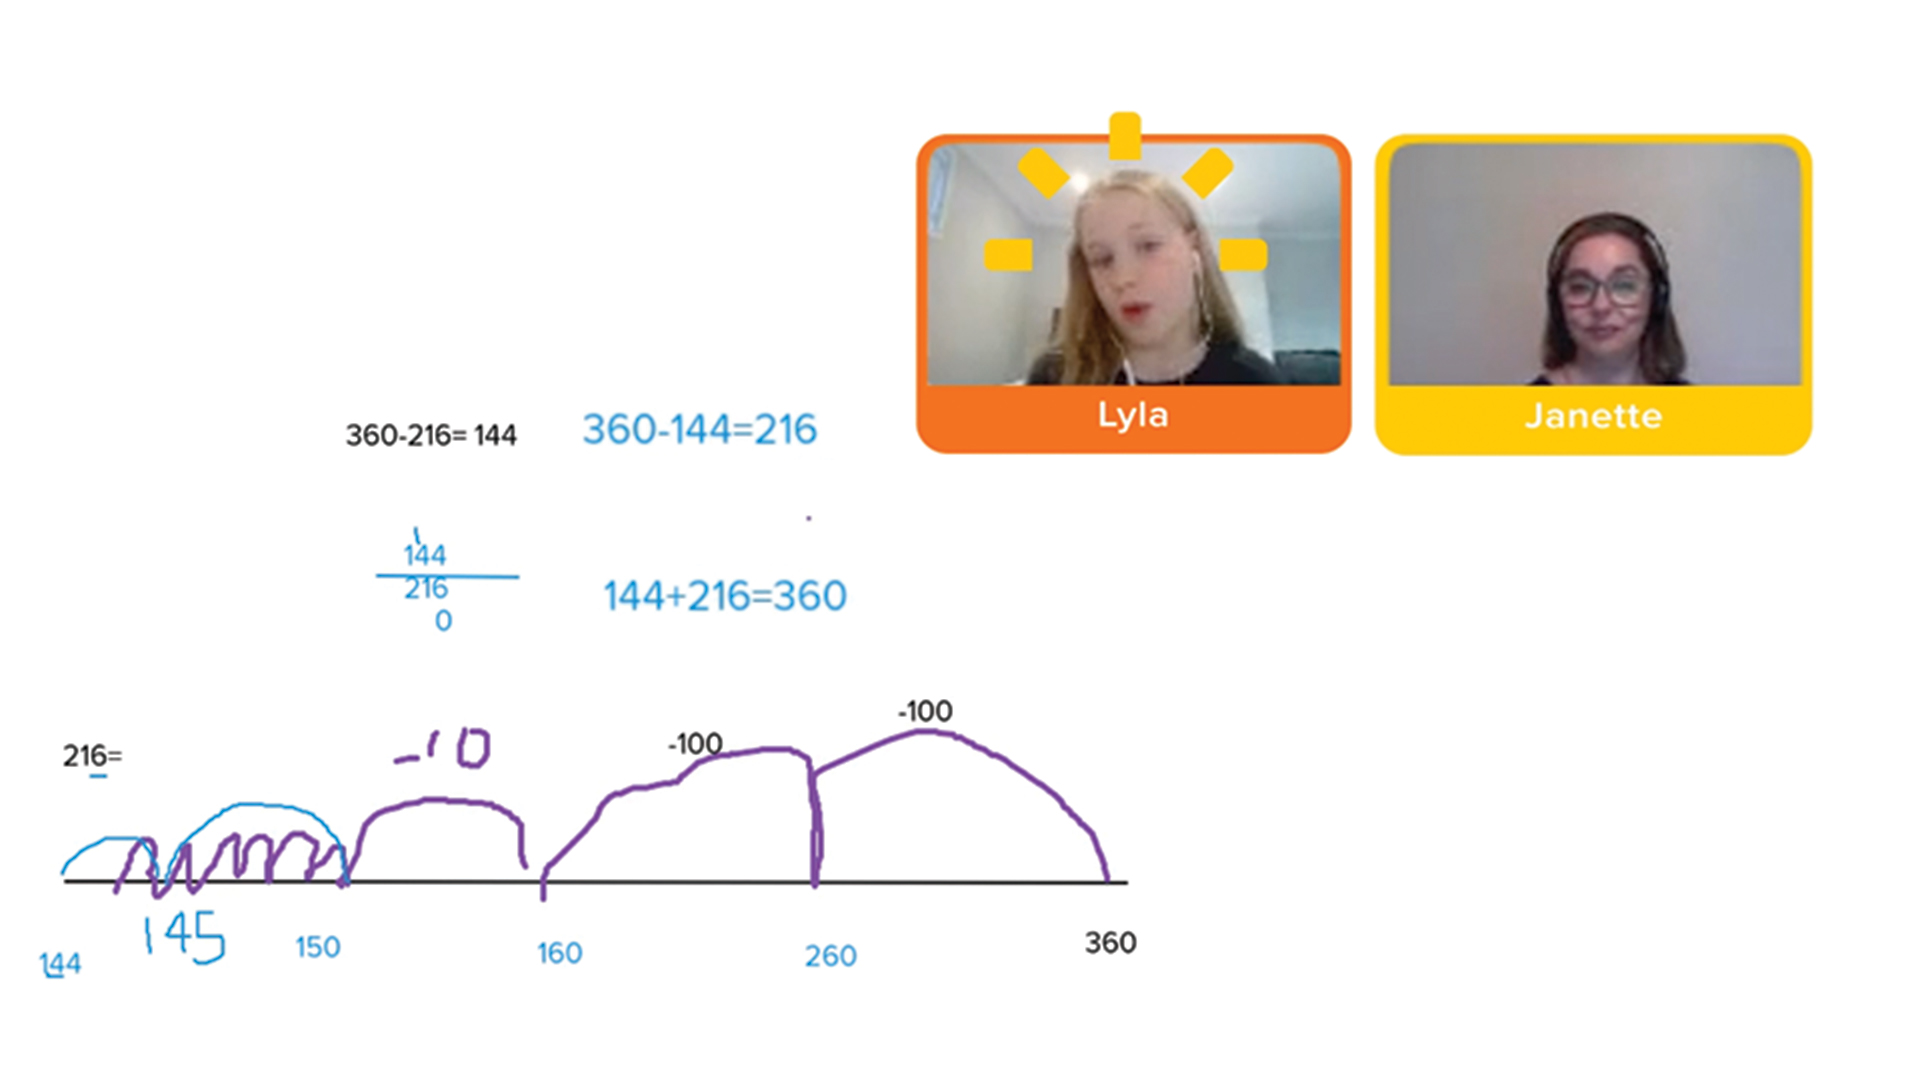
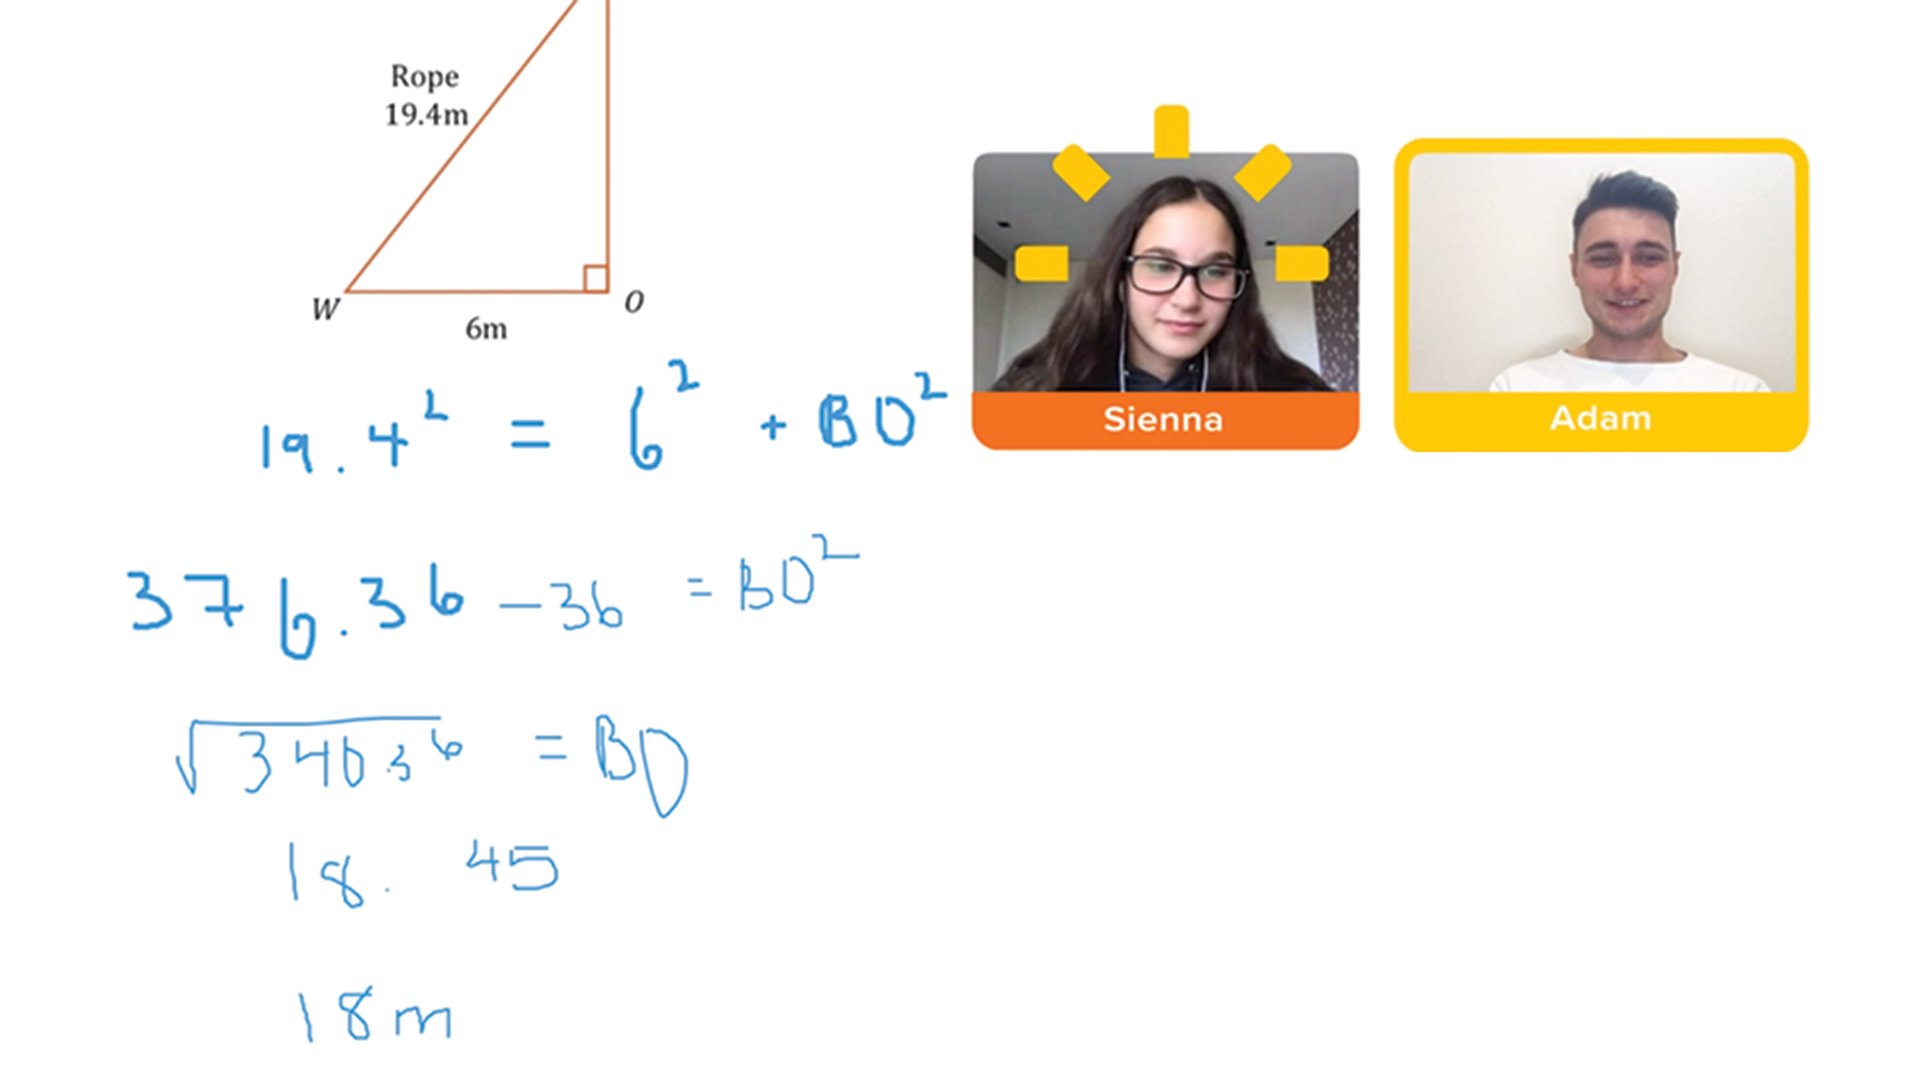
Cluey tutors teach face-to-face in a live online session that includes audio, video and the use of our collaborative whiteboards.
Customised to suit your student’s needs, we work through problem areas they’re struggling with (or provide topic reinforcement or extension programs where required).
- Discussion (about the problem)
- Demonstration of how to solve it
- Challenge for the student to solve, with help if needed.
We’ll even provide practice questions to work on between sessions, so they can master the topics they need to learn.
We've got all your Maths learning goals covered
Address a specific individual need
Perhaps the class room just isn't meeting all their learning needs or you want to prepare for a specific assessment.
Let's build a learning program for
Tutoring that really counts

Meet Dr Selina Samuels
Dr Samuels and her Education team developed Cluey's unique CENTRE approach, and have created interactive learning programs that map to the curriculum and allow students to work at their own level and pace.
Maths Tutoring Program Based on the National Curriculum
Our Maths program has everything you require to master the subject. We work through the syllabus with you, starting with what you're currently learning at school, and adjust the program based on your specific needs and pace of learning.
Meet some of our 2,521+ expert Maths tutors
Our tutors are all qualified teachers, exceptional ATAR achievers or experts in their respective fields.

Iliada
VIC Teacher
Mathematics: Primary
English: Primary
Iliada is currently studying a Bachelor of Education (Primary and Early Childhood) at the Royal Melbourne Institute of Technology. In 2018, she completed her Diploma of Early Childhood Education and Care. She has had practical placements in local schools teaching Mathematics, English, Science and also has experience with children with additional learning needs. Iliada's teaching style is to meet the individual needs of each student, acknowledging that students are at different points in their learning and possess different learning needs.

Ben
Mathematics: Secondary
Ben is currently studying his Masters in Education and has experience tutoring Maths. Ben is passionate about developing students key numeracy skills for life-long use as they work towards acquiring educational independence. Ben believes in fostering a positive and encouraging learning environment where students can engage in collaborative discussions and feels that all students can reach their potential.

Naomi
VIC University Student (Bachelor of Arts)
Mathematics: Secondary
English: Secondary
Naomi completed Year 12 with an ATAR score of 98.05 and is currently studying a Bachelor of Arts at the University of Melbourne. She loves to learn new things and enjoys working with others to find what learning techniques they benefit from in order to achieve the most academically.
How does our approach to learning work?
Tailored tutoring with a plan
The learning program
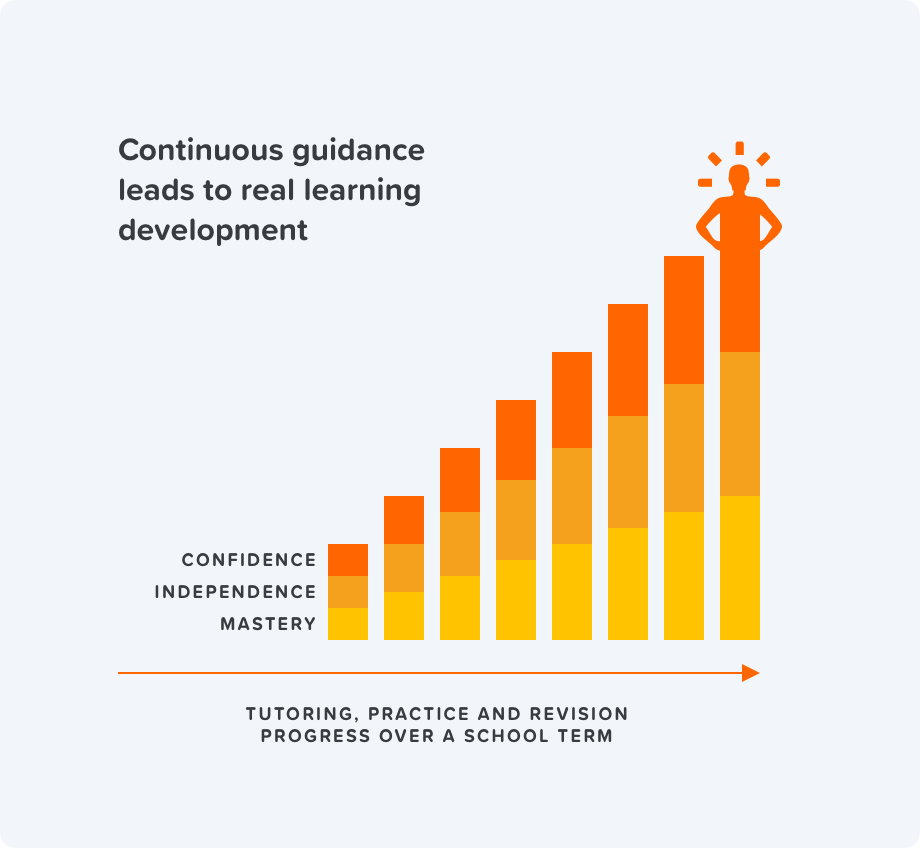
Structured around your child's individual needs and goals, our learning programs adapt over time to build confidence and offer the right help at the right time.
Quality content
- Developed by our experienced education team, the content in our learning programs is structured according to your child's skill level and individual needs.
- We use a range of approaches to meet the needs of different students. Our approach is always clear and unambiguous, and designed to help your child thrive.

Tutoring sessions
- Live, face-to-face and online
- Expert tutors matched to your child's needs
- Demonstration, guided exercises and reviews
- Designed to be fun and engaging
View 1-to-1 Primary Maths Session
View 1-to-1 Secondary Maths Session

Practice exercises
Optional practice questions and exercises to work through between sessions.

Regular reporting
Feedback after every session helps you keep track of your child's progress.

Learn from home (or anywhere) via our online platform.
Schedule sessions when they suit you, between 7am and 10pm, 7 days per week.
Reschedule easily when things get busy
From step one to step done, we're with your child for their entire learning journey.

Session recordings allow your child to revise at any time.

Progress reports ensure your child is getting the right help at the right pace.

Guided tutoring helps your child realise their potential.
Let's build a learning program for
We've helped thousands of Aussie families
From catching up, building confidence and excelling in school, parents and students alike agree that Cluey works.

82% of Cluey parents agree their child’s grades have improved

85% of Cluey parents agree their child is more confident
Cluey is helping students all over Australia
Read reviewsCluey Learning is GREAT & Takes the Stress Out of Getting your kid to a tutor
“I am so happy with Cluey Learning. I was a little apprehensive about the whole online tutor thing but it has worked out better than I could have hoped. My son was very worried about having to go to a tutor for Year 8 Math, however, he LOVES his Cluey Learning tutor and is getting great results. He was failing math at the start of the year but is now getting around 80% in his school math's tests which is a huge improvement & my son is no longer worried about going to his math class. It's less threatening for my son to have his own personal online tutor and you also don't have the stress of finishing work and driving your kid to the tutor. Can't recommend Cluey Learning enough and it's also really easy to reschedule sessions if needed.”


As featured in
Our report card is in and feedback is positive.
(Click a logo to read more)


Our Partners
We partner with Australian charities, education and community organisations to assist students with their learning and support educational research.
Learn more about the Cluey Impact program

Get your personalised program, pronto!
Enter a few details below
School Year
Please select a year level
Cluey 1 Hour Tutoring Sessions
Weekly learning through live tutoring sessions, feedback & practice
Each student’s individual learning journey is supported through a series of live face-to-face sessions with an expert tutor matched to the student's needs. We cover all the theory and examples needed to ensure comprehension, and our sessions are designed to be engaging and encouraging.
Our expert tutors offer guidance through demonstration and worked examples and assign targeted practice questions to help students master the topics and concepts covered.
After each session, personalised feedback is provided to help students and parents track their progress.
Session breakdown
First 5 Minutes
Establishing the session theme, why are we here?
- Discuss student’s areas of focus (if first session)
- Review previous session's assigned practice (if subsequent session)
- Set session learning goals
45 Minutes
During the session
- Work through exercises based on the topics and concepts for each learning goal
- Tutor demonstrates, guides and explains concepts
- Work through any challenges
- Students are encouraged to explain their thinking to clarify their comprehension
Closing 5 Minutes
Reflection and looking ahead
- Reflect on what has been achieved in the session
- Set practice questions
Post-session 5 minutes
Tutor written feedback
- Tutor provides personalised written feedback about the session to help track progress